Author: Chris Fryer

  • TradingView Subscriptions 2026: Features & Its Comparison

    TradingView Subscriptions 2026: Features & Its Comparison

    Do you ever feel like you\’re missing out on good chances to make money in the stock market?

    Imagine having a tool that not only tells you when to buy or sell but also helps you understand the market better.

    Welcome to TradingView—a platform where you can keep an eye on your investments, check out different financial markets, and meet other traders.

    Whether you\’re just starting or you\’ve been trading for a while, TradingView has everything you need to make smarter decisions and catch those big opportunities.

    Don’t miss out; see how TradingView can change the way you trade!

    🚀 Ready to Trade for Free?

    Free until you are ready

    </p

    Free, until you\’re ready! Start by checking out how all the markets are performing. Then, dive into the action on the platform trusted by 90 million traders.

    $0 forever
    No credit card needed. Signing up is free!

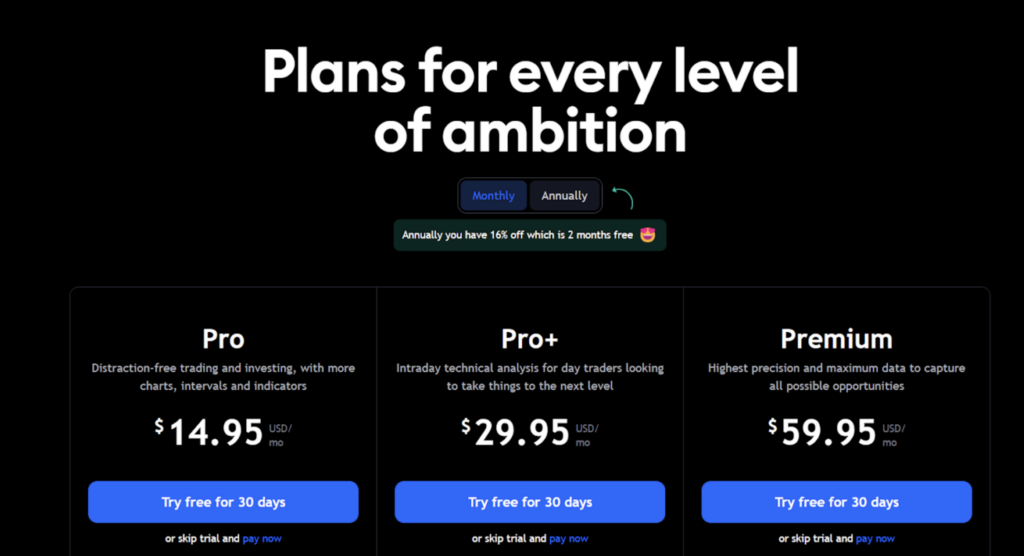
    🤔 How Much TradingView Costs?

    📍 Non-Professional

    DetailsEssentialPlusPremium
    Monthly Price$12.95/month$24.95/month$49.95/month
    Annual Price$155.40/year$299.40/year$599.40/year
    Annual Savings$24.00$60.00$120.00
    Features2 charts per tab, 5 indicators per chart, 10K historical bars, 20 price alerts, 20 technical alerts, 10 parallel chart connections, no ads, volume profile, custom timeframes, custom Range Bars, multiple watchlists, Bar Replay, indicators on indicators, chart data export, intraday Renko, Kagi, Line Break, Point & Figure charts, charts based on custom formulas, Time Price Opportunity, volume footprint, auto chart patterns, second-based alerts, alerts that don\’t expire, publishing invite-only scripts…4 charts per tab, 10 indicators per chart, 10K historical bars, 100 price alerts, 100 technical alerts, 20 parallel chart connections, no ads, volume profile, custom timeframes, custom Range Bars, multiple watchlists, Bar Replay, indicators on indicators, chart data export, intraday Renko, Kagi, Line Break, Point & Figure charts, charts based on custom formulas, Time Price Opportunity, volume footprint, auto chart patterns, second-based alerts, alerts that don\’t expire, publishing invite-only scripts…8 charts per tab, 25 indicators per chart, 20K historical bars, 400 price alerts, 400 technical alerts, 50 parallel chart connections, no ads, volume profile, custom timeframes, custom Range Bars, multiple watchlists, Bar Replay, indicators on indicators, chart data export, intraday Renko, Kagi, Line Break, Point & Figure charts, charts based on custom formulas, Time Price Opportunity, volume footprint, auto chart patterns, second-based alerts, alerts that don\’t expire, publishing invite-only scripts…

    📍 Professional (Pro)

    Serious plans for serious investors
    FeatureExpert PlanUltimate Plan
    Monthly Cost$199.95$499.95
    Annual Cost$2,399.40$5,999.40
    Annual Savings$480.00$1,200.00
    Charts per Tab1016
    Indicators per Chart3050
    Historical Bars25K40K
    Price Alerts6001,000
    Technical Alerts6001,000
    Parallel Chart Connections80200
    AdsNo adsNo ads
    Volume ProfileYesYes
    Custom TimeframesYesYes
    Custom Range BarsYesYes
    Multiple WatchlistsYesYes
    Bar ReplayYesYes
    Indicators on IndicatorsYesYes
    Chart Data ExportYesYes
    Intraday Renko, Kagi, Line Break, Point & Figure ChartsYesYes
    Charts Based on Custom FormulasYesYes
    Time Price OpportunityYesYes
    Volume FootprintYesYes
    Auto Chart PatternsYesYes
    Second-based AlertsYesYes
    Alerts that Don\’t ExpireYesYes
    Publishing Invite-only ScriptsYesYes
    Second-based IntervalsYesYes
    Tick-based Intervals (BETA)YesYes
    Ability to Buy Professional Market DataYesYes
    First Priority SupportYesYes
    Offers

    </p

    ➡️ Additional Information:

    • 16% off annually (equivalent to approximately 60 days free).
    • Sales tax may be added depending on your location due to TradingView, Inc. being registered for sales tax purposes in certain countries.
    • Options to start now or get in touch for enterprise solutions are available for both plans.

    Quick Links:

    🧐 What Makes TradingView Best In The Segment?
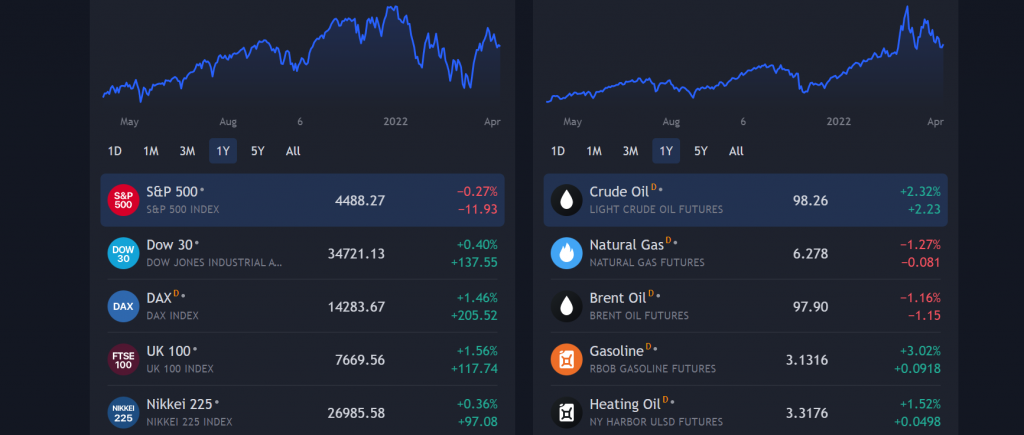
    Global market in your hands

    📍 Social Networking for Traders

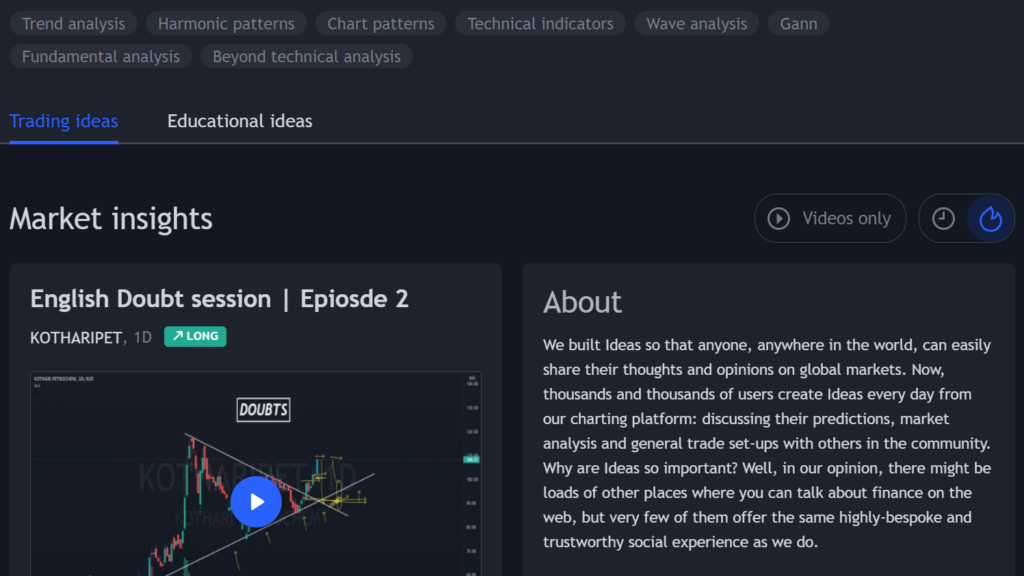
    TradingView combines elements of social networking with stock trading. Users can share their trading strategies, charts, and insights with other community members, fostering a collaborative environment that’s unique among trading platforms.

    📍 Pine Script

    This is TradingView’s built-in scripting language that allows users to create their own custom trading indicators and strategies. Pine Script is relatively easy to learn and enables traders to tailor their tools to their specific trading needs.

    📍 Multi-Timeframe Analysis

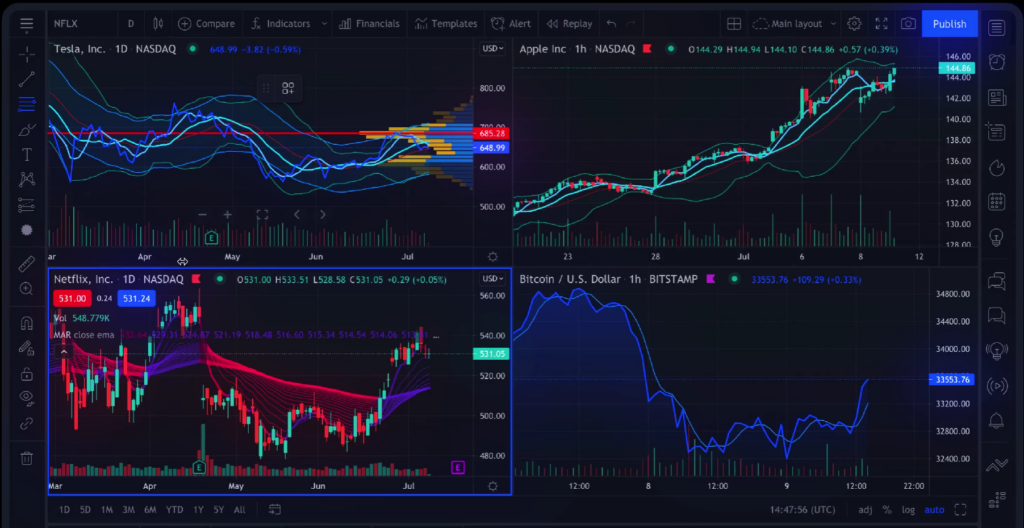
    TradingView allows users to view multiple timeframes on a single chart simultaneously. This feature is especially useful for traders who want to see long-term trends alongside short-term price actions.
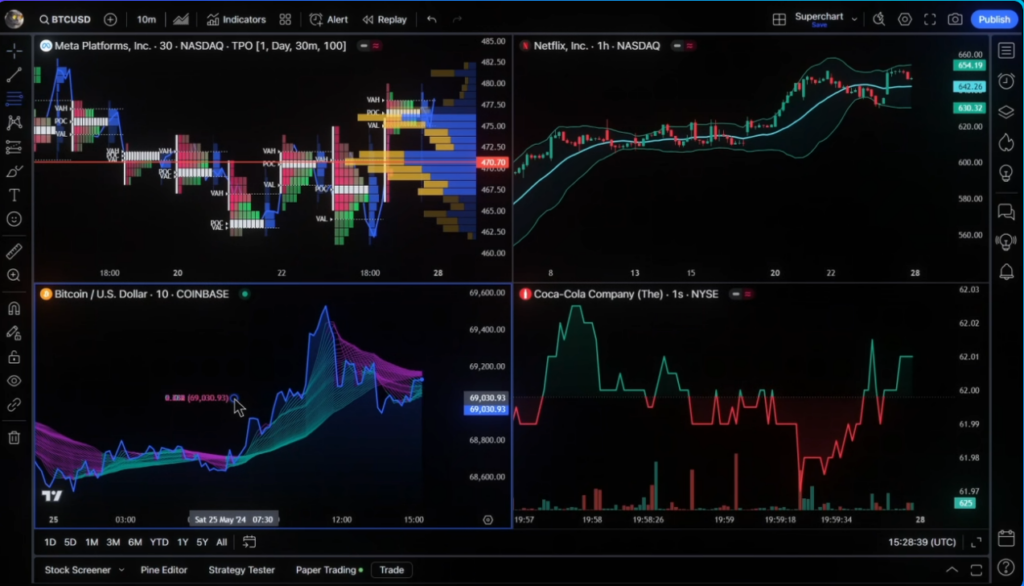
    Multiple time frame

    📍 Paper Trading

    TradingView features a paper trading simulator, allowing users to practice trading with virtual funds. This feature is perfect for beginners looking to learn without financial risk or for experienced traders testing strategies in a risk-free environment.

    📍 Advanced Charting Tools

    The platform provides an extensive array of charting tools and technical indicators which are highly customizable, providing traders with the flexibility to configure the charts exactly how they want.

    📍 Trading Directly From Charts

    Users can execute trades directly from charts without having to navigate away to a separate trading screen. This feature integrates with multiple brokerage platforms and enhances trading efficiency.
    On every street

    </p

    📍 Playground Environment

    TradingView includes a feature called the \”strategy tester,\” a kind of playground where traders can back-test strategies using historical data to see how they would have performed.

    📍 Public and Private Indicators and Strategies

    Users can share their own custom indicators and strategies with the community or keep them private for personal use, adding an element of customization and learning from others.

    📍 Heatmaps

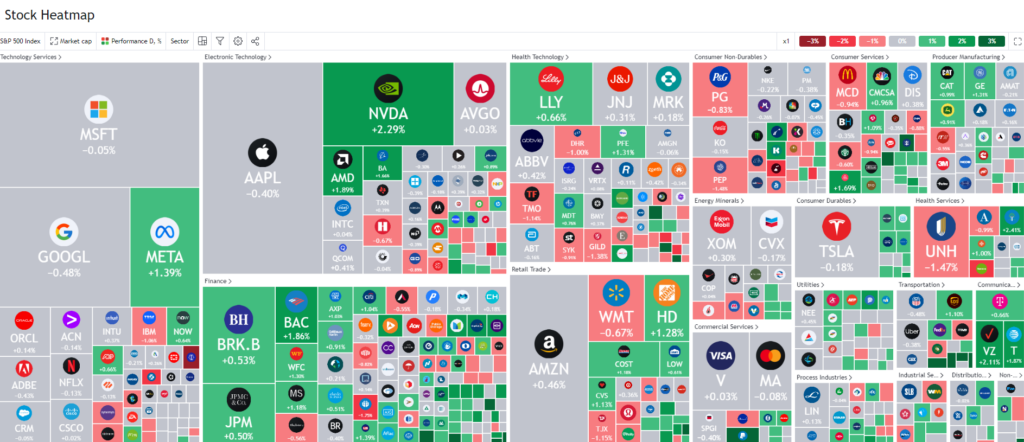
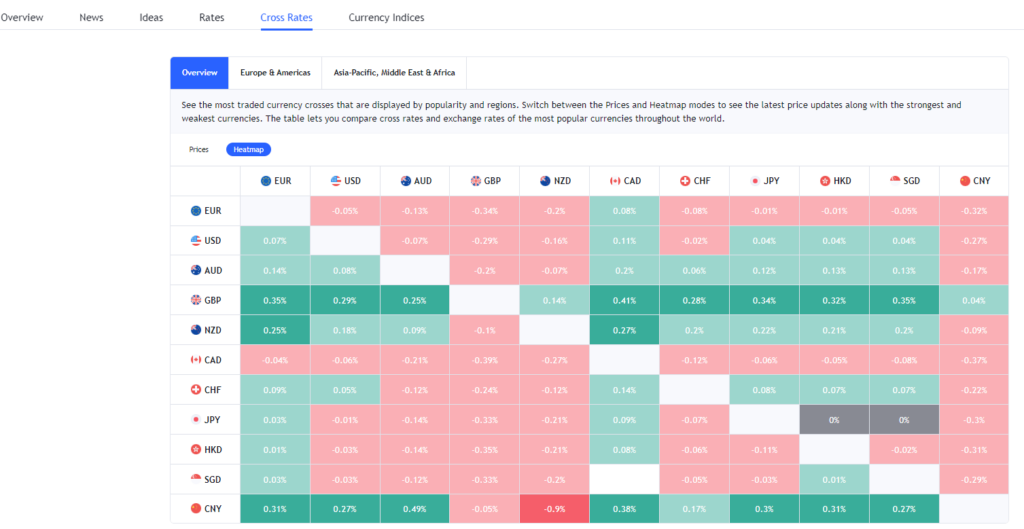
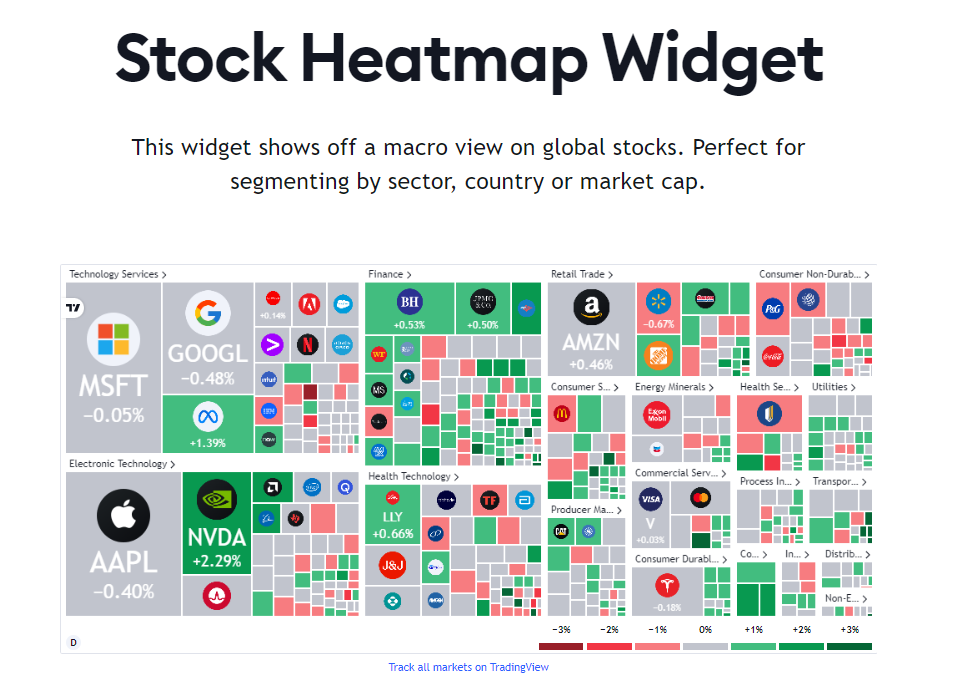
    TradingView offers market heatmaps, which provide a visual representation of market performance across various sectors and asset classes. These heatmaps help traders quickly identify trends, outliers, and opportunities in the market.

    💸 Which Subscription Plan Best Fits Your Needs? Detailed Comparison
    Love in every tradingview

    </p

    FeatureBasicEssentialPlusPremiumExpertUltimate
    Signup/StartSign upTry freeTry freeTry freeStart nowStart now
    Charts per Tab12481016
    Saved Chart Layouts1510CustomCustomCustom
    Custom Time Intervals
    Second-based Intervals
    Tick-based Intervals (BETA)
    Intraday Renko, Kagi, Line Break, etc.
    Custom Range Bars
    Intraday Charts on Custom Formulas
    Export Chart Data
    Customizable Chart Types171717212121
    Compare Symbols
    Dividend-adjusted Charts
    Interactive Earnings, Splits, Dividends
    Historical Annual Financial Data7 years20 years20 years20 years20 years20 years
    Historical Quarterly Financial Data8 years8 years8 years8 years8 years8 years
    Extended Trading Hours
    Simultaneous Chart Connections210205080200
    Bar Replay
    Historical Data by Day and HigherAllAllAllAllAllAll
    Historical Data by the Minute42 days180 daysAllAllAllAll
    Historical Data by the SecondAll
    Indicators Replay
    Trading in Bar Replay
    Technical Analysis and Algorithms
    Indicators per Chart2510253050
    Financials per Chart147101525
    Custom Indicator Templates1110+110+
    Volume Profile Indicators
    Time Price Opportunities
    Volume Footprint
    Pine Script™
    Backtesting for Trading Strategies
    Export Strategy Data
    Deep Backtesting
    Candlestick Patterns Recognition
    Auto Fib Retracement
    Multi-timeframe Analysis
    Time Limit for Calculations20s40s40s40s60s100s
    Bar Magnifier
    Auto Chart Patterns
    Watchlists
    Symbols per Watchlist301,0001,0001,0001,0001,000
    Alerts
    Alert Durations2 mo.2 mo.2 mo.
    Screener
    Data Export
    Customer SupportRegularPriorityPriorityFirst PriorityFirst PriorityFirst Priority

    Quick Links:

    🔥 Conclusion

    The Basic Plan is ideal for beginners exploring charting tools, while the Essential Plan suits casual traders needing basic features. The Plus Plan works for intermediate traders seeking enhanced analysis tools.

    Advanced traders and professionals will benefit most from the Premium Plan for in-depth analysis and flexibility. For experts managing complex strategies, the Expert Plan offers unmatched customization, while the Ultimate Plan is perfect for institutional traders requiring extensive features and support.

    Recommendation: If you\’re starting out, the Plus Plan balances cost and functionality well. For serious traders, the Expert Plan provides robust tools.

    Institutional or heavy users should consider the Ultimate Plan for its unparalleled capabilities. Choose based on your trading needs and goals!

  • TradingView vs Finviz: Which Is The Best Platform in 2026

    TradingView vs Finviz: Which Is The Best Platform in 2026

    What Is TradingView?

    Suggestions help in different aspects of life as our vision is supported by the experience and evaluation always gets the work done smoothly.

    Trading is a tough nut to crack but if one seeks assistance in terms of evaluation and observing the market trends then the returns aren\\\’t hidden.

    TradingView

    TradingView is a trading-chart platform that helps traders in observing the market trends and understand what the estimation of history says about the future.

    This feature helps traders in better risk management and get confident trading done. As the quote knowledge is power becomes active and the returns start becoming bigger and bigger.

    What Are Some Features Of TradingView?

    TradingView has numerous features which make it to become one of the most visited web portals by traders. Some of such features are listed below

    Do You Know? We have also covered an in-depth TradingView review, you can also check it.

    Exclusive Charts

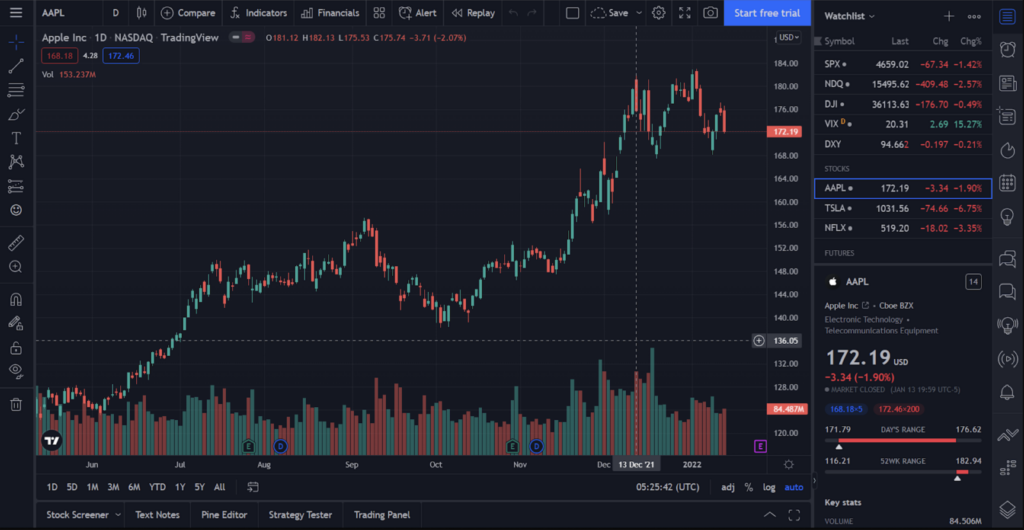
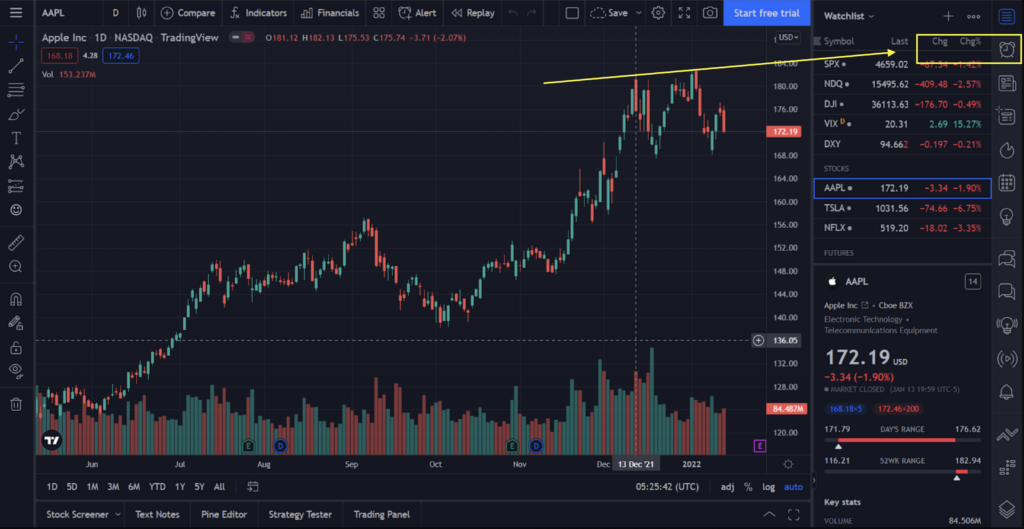
    Charts decide the flow of the market as the smart traders always go up with the process of evaluation rather than the guessing game. TradingView being the website for traders has a wide range of charts for the traders. 12 different types of charts, up to 8 charts per tab supported with second timeframes, bar replay with glitch-free smoothness to provide the detailed representational history of the market trends about the asset.

    TradingView Charts

    Get it Analysed

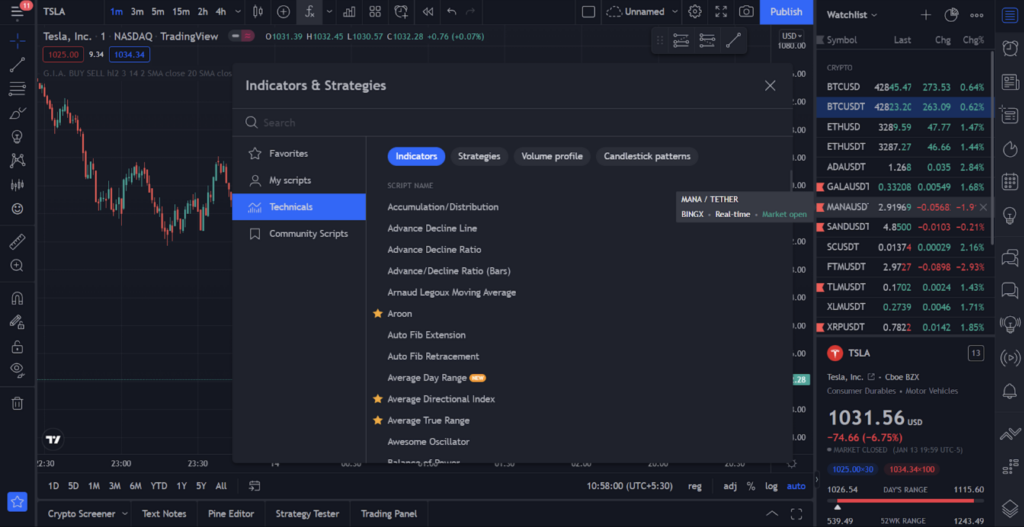
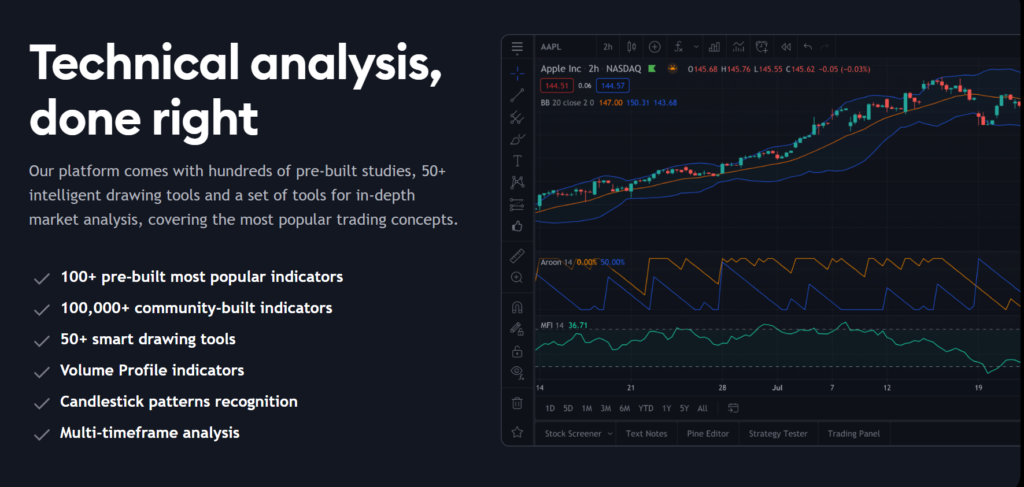
    The analysis is the core of evaluation and it gets the most sought details presented on the table. Technical Analysis on TradingView is done by factors like 100+ pre-built best TradingView indicators, 100,000 community-built indicators, 50+ smart trading drawing tools, multiple timeframes, volume profile indicators, and candlesticks patterns. These factors by TradingView get the work done for users and make them understand the very core trends emerging in the market.

    Never Miss The Opportunity With Alerts

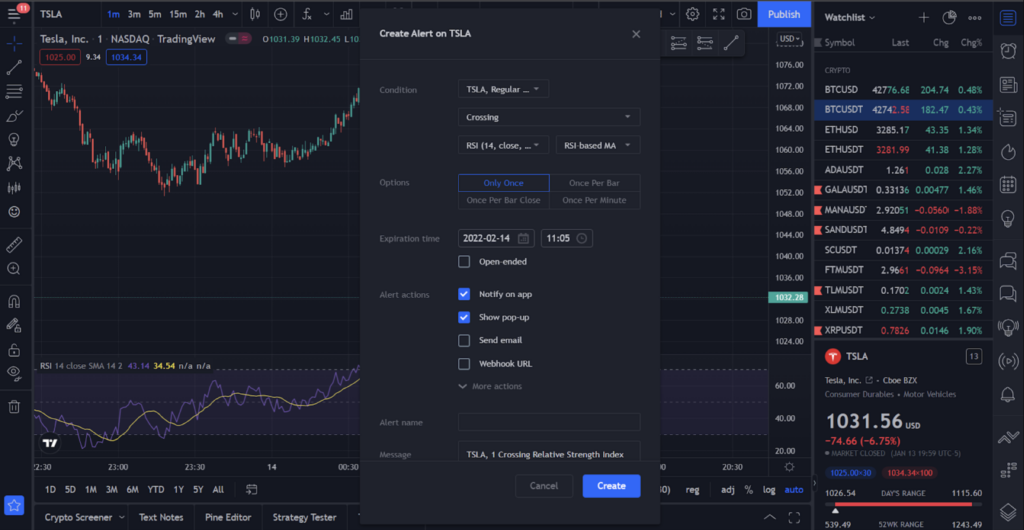
    Who wishes to miss the train & the answer is no one. The train becomes more special if it is about high returns and growth as a trader. The market moves every second and achieves milestones so that users don\\\’t miss any of these. TradingView provides alerts on every device and promises to not let anyone miss the hottest news and trends from the market to keep hold over your growth and tackle the impacts of the current event in a finer way.

    TradingView Alerts

    Test & Implement Your Strategies

    The world is full of skilled people and their talent must not go in vain. TradingView supports the strategies traders from all over the globe carry as it provides space to share these strategies with other traders. Traders can also get their strategies tested on the charts based on realistic information which can clearly demonstrate how well these skills are going to work in the market. Testing based on numerous patterns also keeps the work high paced and traders understand all of such strategies by their core.

    If you don\\\’t know how to use TradingView don\\\’t worry, We have covered a guide on how to use TradingView.

    Indicators-and-Strategies-TradingView

    What Are Some Pros Of Using TradingView?

    TradingView is one of the favorite websites of traders. This is being possible only because of its numerous attractive features as traders get to enjoy following the pros of tradingview

    Free 30 Days Trial

    Get free 30 days trial for the premium Subscription of TradingView & you have to pay nothing for the trial

    Easy to use

    TradingView is not difficult to use and anyone knowing the basic knowledge of surfing can go through it easily. The web portal is based on current web advancements and traders don\\\’t have to be in a mess while availing of the services.

    Huge chart database

    Trading Charts has found its home in the lap of TradingView. TradingView has the largest range of charts available which helps in better trading evaluations.

    Bar replays

    Bar replays on TradingView are very simple to use to back-test the strategies and can be used like using any other social media platform. The bar replays help in better playback mode options and deliver in multiple time frames.

    What Can Be Some Cons Of Using TradingView?

    Numerous structural features can be counted as cons to the TradingView platform. Such cons are as follows

    Customer service

    TradingView isn\\\’t something known for its customer service. As it is slow in terms of providing the basic support needed to overcome a mess offered sometimes by the platform.

    Limited Free version

    The free version of TradingView doesn\\\’t match the game at any cost and traders not being able to get the premium version fails to get the accurate knowledge of even average scale services.

    Premium Issues

    TradingView isn\\\’t so smooth in terms of making trades with limited features in the free version, you have to buy the premium service for advanced technical analysis. It gets stuck and also multiple users\\\’ accounts are found locked which limits the trading socializing.

    What Is Finviz?

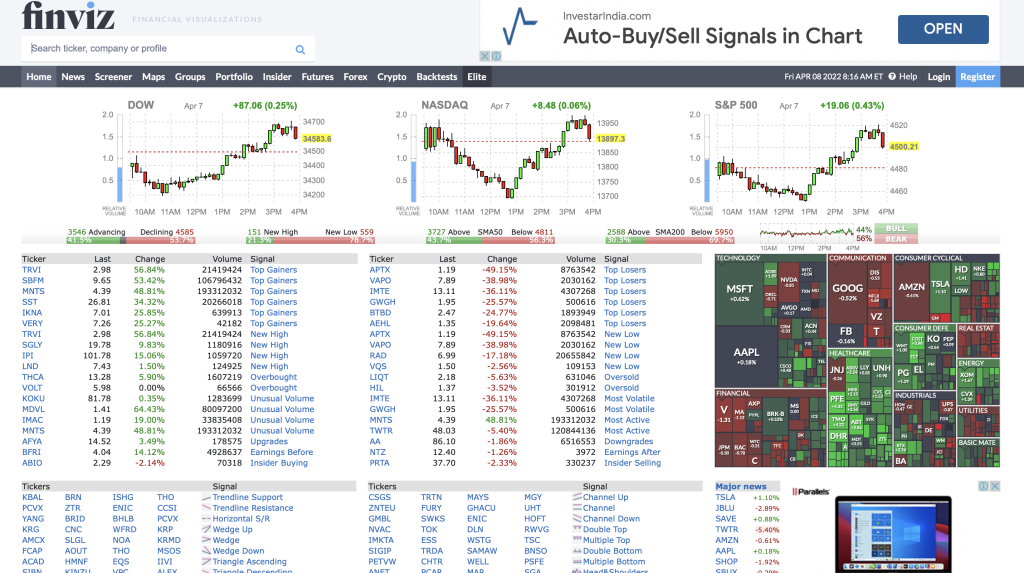
    Finviz is the financial wizard of the town. The magic of this wizard helps in quickening the process of evaluation by providing information based on set criteria.

    Finviz is known for financial display which offers information in an engaging way that does the work for the traders easily. It is acing the game of providing financial information to the traders in a high-paced manner.

    Finviz Review

    Finviz is roaring in the market for sure and wishes to keep on making an impact on traders and deciding the flow of the market.

    What Are Some Features Of Finviz?

    Finviz being a traders platform has got multiple trader-friendly features that get the job done efficiently. These features are as follows

    Trends

    Finviz has a section of news that contributes to creating trends. This information is important for the market as they move it up and down. Finviz helps in keeping an eye on all such news which helps in handling the market pressure in a better way and finding a way to get a huge amount of profits.
    What is Finviz

    Tools Over The Screen

    Tools assist trading platforms to make work easier for traders. The screener feature helps traders in the filtration of assets for which they wish to see the trends. This feature also allows users to save the data for a later option, the only limitation to this feature is that the visitor must register. Unless the basic screener can be used by anyone to use the data.
    Maps

    The future of assets depends on multiple features like policies being opted by their nation or the separate announcements by the brand specifically for some geographical area or set of users. This can be checked on a regular basis by using Finviz as it helps in tracking down particular stocks. Also, the color code is adopted by Finviz which can tell at a glance if the market is going up or down.

    Special Facts

    The insider trading section of Finviz keeps an eye over the trading done by mammoth traders. As these traders can single handedly move the market which makes every move by them very important. Finviz helps in nothing, even the minute movements done so that traders can decide which direction they wish to go.

    benefits of finviz

    What Are Some Pros And Cons Of Finviz?

    Some pros which make up the user base for Finviz are as follows

    Free Structure

    Finviz has subscription plans for traders who seek longer and more intense support from Finviz but if you are a new trader then Finviz will get you some basic services for free which can be sufficient in doing evaluation to a smaller level.

    Easy to register

    Finviz doesn\\\’t complicate the registration for users as it wishes to keep the experience smooth. The registration process can be done by simply enrolling on the website. This process doesn\\\’t cross the timeline of more than five minutes and doesn\\\’t make users wait so much to start their intense trading journey.

    Turn into an Elite

    Finviz subscription plans make every penny count as it gets the most exciting features available by charging some price. The feature for Elite members are most assisting and helping in keeping the trading on track for its subscribers. Annual and monthly plans differ in terms of pricing but both offer smooth services.

    What Can Be Some Cons Of Finviz?

    As the positive factors cover the Finviz with a positive blanket there are some issues related to it too. Finviz will sooner or later get these settled but till then cons are part of Finviz. Such cons which can repel users are as follows

    Tons of ads

    The market moves with every heartbeat and when you are in a hurry of trading and want to get the fastest evaluation done then even the 15-second ads become annoying. Free users on the platform of Finviz have to face this mess of ads which can be discomforting in terms of patience to traders.

    Lack of features if you don\\\’t pay

    The bag full of exciting features is kept for the users paying the price for availing of the services. It helps in understanding the marketing model of Finviz but on the same hand, it disappoints the users who deserve some of such exciting features without a subscription.

    Final Conclusion of TradingView vs Finviz

    As per the overall review, TradingView Wins if we compare it with Finviz. No doubt, Finviz is also a good platform but still, it lacks some features & User-Interface is old.

    Both of the platforms wish to make things easier for the traders but they do differ in terms of services. As there can be a comparison between any two things to get the point of satisfaction towards one extracted.
    Both majorly differ in terms of parameters and combinations which can be made for the process of filtration. The count of parameters screening offered by Finviz rests at 65 though for TradingView it is 100, more combinations can be experienced on Finviz.

    Both have different pricing plans for subscribers. Finviz fails to offer a chatroom too but TradingView has got the work done in this aspect.
    Both have their own qualities and features but TradingView they have eyes on the traders about what can kind of services they desire.

    Other Alternatives

    https://shipchain.io/tradingview-alternatives/
    https://shipchain.io/tradingview-vs-mt4/
  • TradingView vs Investing.com: Which One is Best in 2026

    TradingView vs Investing.com: Which One is Best in 2026

    Tradingview helps keep an eye

    Online trading is a new sensation among this generation. A big part of youth is investing in stocks to gain more money. Trading is a way to make your money work for you. Online trading is part-time as well as full-time work for anyone. There are plenty of platforms that provide services of online trading and all are growing well every day because of the sudden and incredible popularity of online trading.

    Trading was a popular concept of earning for a long time but after online trading came into the market the popularity of trading increased at a high rate. Online trading can be done from anywhere it can be a good choice of work from home which enables to work and earn in every situation. Trading has become an easy to access concept after the entry of online trading.

    What is TradingView?

    What is Tradingview

    TradingView is a platform that visualizes the growth of any stock, crypto, forex &, etc. Many traders use TradingView to know about stocks, and crypto to earn more and reduce the chances of loss. Trading is a risky business if you\\\’re not applying the principles of the market.

    Suggestions & help when you\\\’re being supported by the experience and evaluation then it feels easy to do any job and enhance the impact also. Trading is a popular but not an easy concept but if you\\\’re capable in terms of analyzing and observing the market trends then you can predict the outcomes with a high success rate. TradingView is a platform that provides trading charts and many other services which help traders in observing the market trends and understand the possibility of stock in growing. This helps a trader in better risk management and to get confident trading skills. TradingView is a path shower for traders

    Features of TradingView

    Tradingview features share the skill

    TradingView is a platform with multiple features helpful in trading which enables it to become the most popular site among traders. These features are very different and more effective from other sites which makes TradingView a better and unique platform.

    Some of the features are –

    Amazing Charts

    TradingView

    Charts are the best and most effective way to predict the market. Smart traders always believe in finding the real possibilities rather than the guessing game. TradingView provides a huge range of charts for traders to know about the real market and to predict the possible growth of the stock or any trade market. Different charts show different aspects and help in predicting different stocks and different possibilities.

    Analyzing

    The analysis is the basic way of evaluation and it is the most wanted detail for any trader to know about the growth of any stock. Technical Analysis on TradingView is done by factors like 100+ pre-built indicators, 30M+ communities built indicators, 50+ smart trading drawing tools, multiple timeframes, volume profile indicators and candles patterns. These factors by the TradingView get the most work done by users and make them understand the basic trends and basic way of evaluating the market.

    About the alerts and notifications

    Everybody wants to skip to the good part. The market moves every second and makes major or minor differences. TradingView sends alerts and notifications of every movement so that users don\\\’t miss any of these. TradingView provides alerts and notify every device and promises to not let anyone miss the best news and trends of the market to keep you updated and help you to tackle impacts of current events to analyze the future.

    Learn from other\\\’s skills

    The market has a huge number of skilled people and their knowledge & talent can help you to grow. TradingView lets you know about the strategies and techniques of those players who are already a winner in the game and helps you to grow with their talent. Traders can also use & check those strategies and techniques on the charts to know about the possibility of success. Testing based on certain patterns also keeps the work speedy and lets traders learn those strategies on their own so that they\\\’ll learn practically.

    Pros of TradingView

    TradingView is one of the most popular websites among people who do online trading. TradingView is so popular because of its incredible features and pros that combine to make TradingView a better option. some of the pros of TradingView are –

    Easy to use

    TradingView is an easy-to-use platform that gets the complicated work of traders done. TradingView is easy to access and all features are easy to use and understand.

    A big chart database

    TradingView has a big list of charts that enables you to know every aspect of any stock which leads to a properly planned investment.

    Bar replays

    Bar replays in TradingView are easy to use and simple like using any social media.

    Cons of TradingView

    TradingView is a great site to learn about trading and its aspects. TradingView has many beneficial features and pros which makes it a very popular platform among traders but with this, all TradingView has some cons also. Cins if TradingView  are;

    Bad customer service

    It\\\’s very productive and good to use TradingView till any messy issue occurs on the site because TradingView isn\\\’t so good at providing customer services to solve every single issue occurring while using the website or app.

    Limited Free version

    The free version of TradingView doesn\\\’t provide so much to the users. If you\\\’re using the free version of TradingView then you\\\’ll feel that it\\\’s very unhelpful and you can\\\’t access many of the features of TradingView which is a down point for the platform.

    Premium version issue

    TradingView doesn\\\’t provide premium features smoothly to the users. After getting a premium membership many times it gets stuck and many of the profiles seem to be locked which decreases the expectations of users.

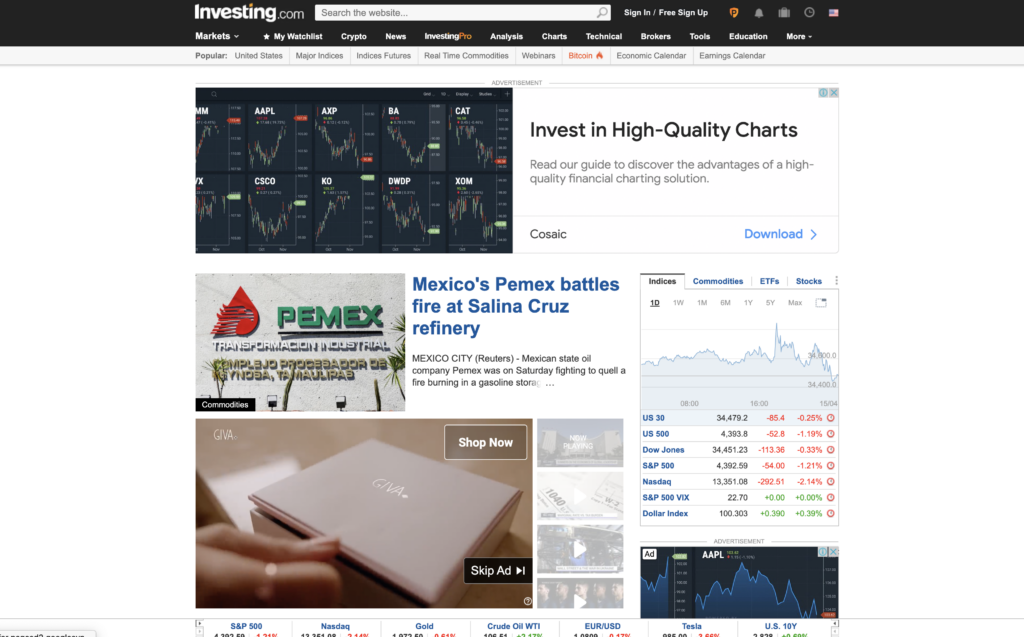
    What is Investing.com?

    Investing.com

    Investing.com works similarly to TradingView. Many features of both are mostly the same. Investing.com was launched in 2007  by Dror Efrat and other co-founders and it\\\’s available in 24 languages Investing.com had 300 employees in 2019 Investing.com is a financial information platform that provides key information to traders to help them in choosing the best stock to invest in. Investing.com is a very informative and useful platform for traders to know about everything happening in the market so that they can invest in the stock with the best possible outcomes.

    Features of Investing.com

    Features of Investing

    Investing.com is a very popular site in the world of trading that keeps traders updated with the market and its movement Investing.com has many beneficial features which work together to make it one of the favorite sites among traders.

    Some features of Investing.com are

    Live updates

    This site provides live updates of more than 100,000 financial products and 70 trading platforms which enables every trader to keep themselves updated with the market to work in full consciousness for making more money and get a successful career in trading at their own pace.

    Maintaining an economic calendar

    Investing.com provides a real date-time of global events which enables you to maintain a calendar for yourself to learn about every financial event on a global platform. This helps in knowing about what is happening and what is going to happen in any region of the world which is related to economic matters of the world.

    Alerting system

    This feature of Investing.com is very useful and one of the most favorite because it delivers alerts on devices when any smallest change occurs in the price and on every single movement in the market which makes it easy to stay updated and allows you to buy on perfect timing.

    Many financial instruments

    Investing.com provides many financial instruments to the users like Technical Summary, Earnings Calendar, Market Quotes, Currency Converter, etc.. which makes their work easier and does the hard work of the traders to save their time and energy. These instruments are very informative and useful and get updated from time to time with advanced features of the site.

    Pros of Investing.com

    Investing.com is a very useful and effective site for traders to enhance their experience with trading and make their work easier and more effective. Investing.com has many features and pros that make this platform a very marvelous platform.

    Some of those pros are –

    1. Premium features without getting a premium membership

    A bunch of financial instruments is very helpful for successful trading. Every instrument has its feature and this all is provided without any premium members which makes it more attractive.

    2. Effective and accurate information

    All information provided by Investing.com is very accurate and effective for better outcomes which makes it a great option to learn about trading.

    Cons of Investing.com

    Investing.com is a very useful and productive platform for traders because of its incredibly good features and pros which work together to make it a better platform but with these positive sides to investing.con do also have many cons too. Cons of Investing.com;

    1. Lots of ads

    Investing.com gives many ads while users are using the features. There\\\’s no way to get rid of those ads for fluent work. Investing.com has no premium membership so they use ads for earnings but these ads decrease the user experience which is a negative point.

    2. Slow updates in the database;

    Investing.com is slow in updating the database which leads to uneven information with less productivity. Slow updates in the database can lead to losing the opportunity of getting a chance to invest at the best timing.

    Conclusion

    Tradingview Conclusion

    Both platforms are good in their ways, both have their different features, pros and cons which makes them different from each other. In this very situation, it\\\’s hard to choose one so the traffic helps you in choosing better among the two bests so the traffic on TradingView is better and higher in an amount which tells that the TradingView is better in user experience and gives you a more effective way to grow.

    FAQs

  • ChartIQ vs TradingView: Which One Is The Best Platform in 2026

    ChartIQ vs TradingView: Which One Is The Best Platform in 2026

    Intro to Chartiq

    In this modern era of time, trading is very popular and loved among all generations. Trading is a very good option for part-time work and also for a full-time option of earning. To get a successful career in trading all you have to know is to analyze charts, learn from others and predict the future based on facts and figures. You have to avoid guessing to reduce the chances of loss.

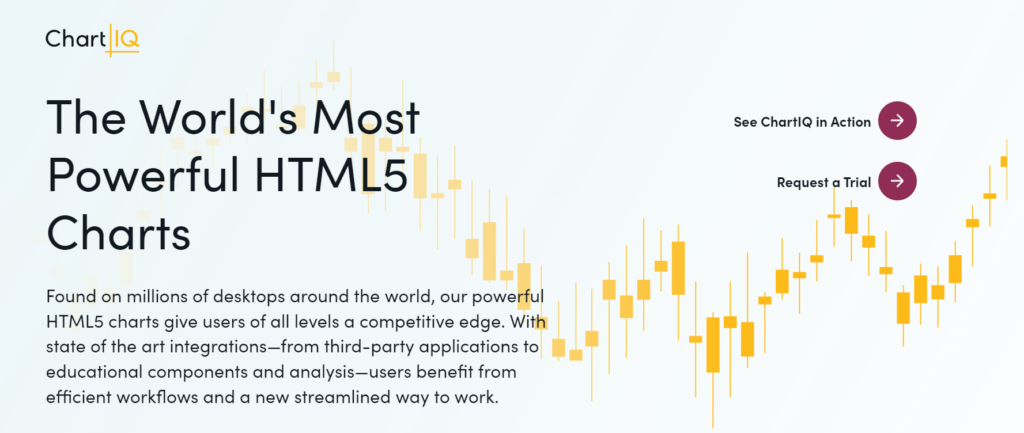
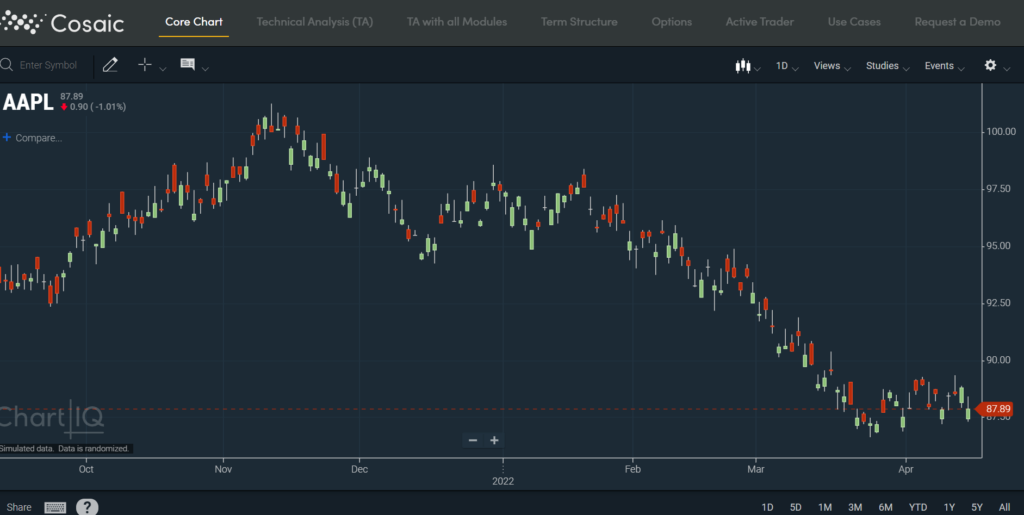
    People say that trading is a risky game, well yes it is but you can reduce the risk by applying your brain and techniques. ChartIQ is a very useful platform for traders ChatIQ is the world\\\’s most powerful HTML5 stock charting library with a huge range of charts and many useful features to enhance your experience and outcomes of your observation.

    Features of ChartIQ

    Features of Chartiq

    ChartIQ is a very popular and very useful platform for those who are working as traders or practicing for that because ChartIQ contains many features that make it a useful platform some of those features are;

    ChartIQ Provides Very Attractive Charts

    Attractive Charts by Chartiq

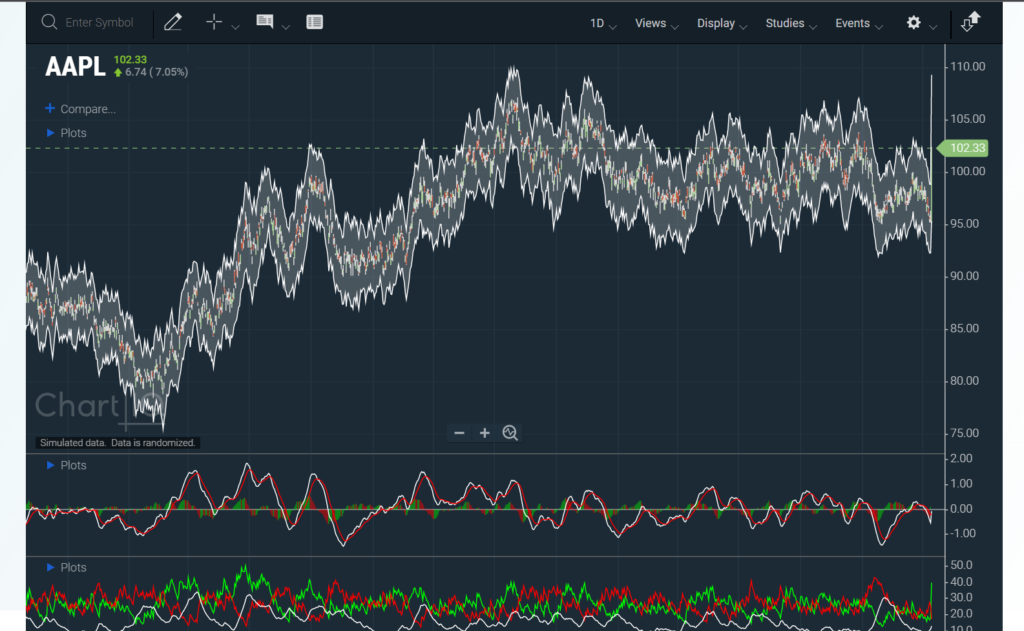
    These charts are highly informative and useful. Charts are the best way to observe and analyze the market these charts enable you to learn more about market growth and movement. ChartIQ provides a very large range of charts which enables us to know about many aspects of the market. Charts help in checking and predicting the upcoming market changes. These charts are provided in many forms like bars, candles, etc…

    Fully Customizable + Quick Time-To-Market

    Customizable and time to time market by Chartiq

    ChartIQ UI templates make it easy to get a financial chart in hours, and “light” customization. It provides fully customizable charts and quickly updated charts so that you can go with the market time and don\\\’t be before the time. This enables you to get to know about the best timing of investment and helps you in knowing about every movement of the market. It reacts with the market very quickly so that you won\\\’t miss any event or movement of the market which leads to up-to-date learning and having the opportunity to earn with every event.

    Cross-platform support

    Cross platform support by Chartiq

    Cross-platform ChartIQ supports every platform and works with any device Android, Windows, OS, etc.. . ChartIQ also works with your native app as a support application which gives you all information about the market and every update about the trading world this is a big plus point of ChartIQ that it gives multiple platform support to enable you to use the precious information provided by chart IQ and using it\\\’s incredible features for your successful trading every day.

    Future Proof

    Chartiq future proof

    The main problem of any trading supporting site or app is that they don\\\’t get updates constantly which leads users to shift to another then platform over time which creates many problems but ChartIQ provides you updates constantly and assures you for the future that ChartIQ will grow and help you to grow with time and bring constant several changes in itself to help you time to time.

    Your workflow solution provider

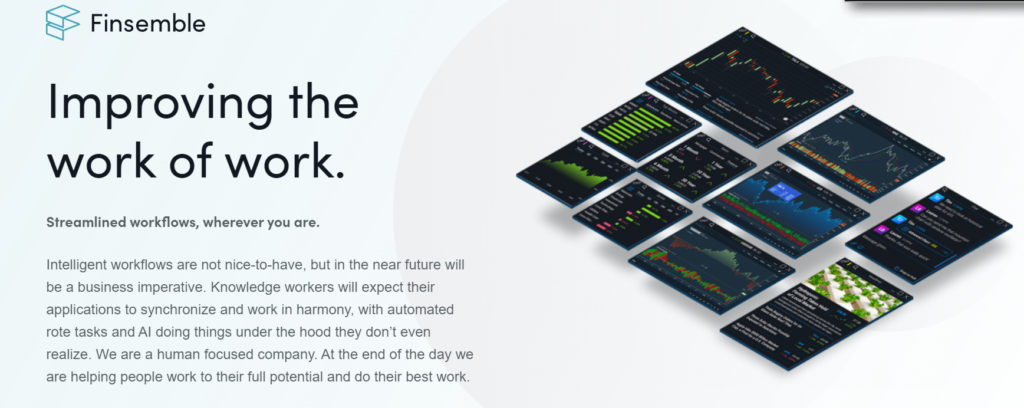
    Financing is getting developed into the app-to-app communication that ChartIQ provides a system that supports every platform to reduce the interruptions that occur in trading by the reason of lack of communication. This is a very big point for ChartIQ because the communication problem is a very popular problem faced by traders during trading because their apps or platforms support only a few others and they can\\\’t work with rests.

    Best-in-class developer experience

    Development is in good hands which delivers time to time development to the ChartIQ and also provides one of the best customer support with a very quick response. The support team of ChartIQ is very quick in responding and always ready for technical solutions and services which enhances the user experience and also reduces the interruptions in using the ChartIQ.if you have a platform with constant support and a good development team then it\\\’s a very enhancing point for your trading and work.

    Pros of ChartIQ

    Pros of Chartiq

    ChartIQ is a marvelous product that enhances the work experience of traders by providing very informative charts with the world\\\’s most powerful HTML5 stock charting library. ChartIQ also supports a cross-platform method which enhances the work and reduces interruptions. ChartIQ is so popular because of its features and pros, some pros of ChartIQ are –

    Very informative charts

    ChartIQ provides very informative and attractive charts which enable you to learn about the movement and growth of the market which is very useful for traders in working and earning more by trading.

    You\\\’ll get cross-platform support

    Cross-platform enables you to access ChartIQ with multiple platforms of trading and enables you to use every information of ChartIQ within your native platform.

    Provides constant updates

    ChartIQ provides constant updates which lead to up-to-date information and events of the trading market with information on every movement of the market to enable you in using every opportunity to make a profit.

    Introduction to Tradingview

    TradingView

    Trading is a swing to reach financial milestones faster as better evaluated information helps in generating faster results. The trading surrounded by better and more realistic information helps in creating finer results. Such information is vital in terms of accepting the idea evaluation over guessing. The way trading can be aced by using the resources and tools that can be managed is the best process to find good returns.

    About Tradingview

    What is Tradingview

    Tradingview is the destination for all of the realistic information and tools desired by traders to understand the definition of perfect risk management and profit-driving. Tradingview is in the market to help traders use the collected data and enjoy the benefits of its features.

    Tradingview has numerous features which make it stand in the position where it is now –

    Analysis

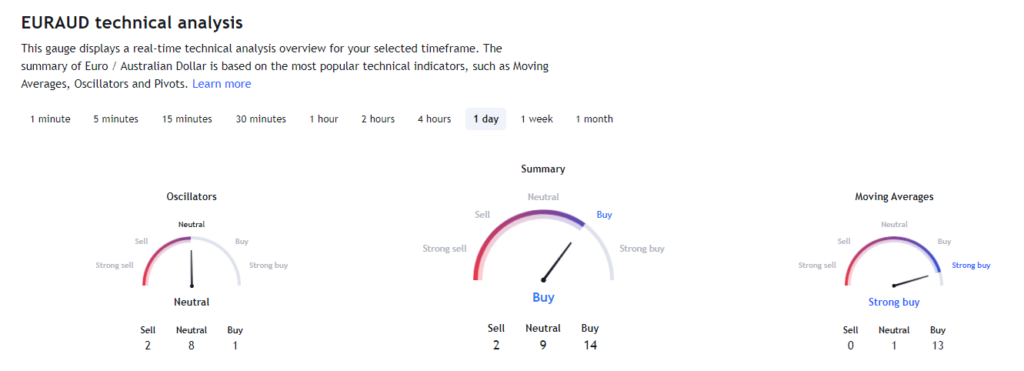
    Tradingview technical analysis

    The standard analysis can be enjoyed on the TradingView based on different information. The technical analysis helps in getting a quick observation of the assets by seeing the color code too. Analysis helps in understanding the process of evaluation and how the stock has been performing and how it is going to perform shortly.

    News Alert

    TradingView Alerts

    The news alert is about keeping a check on the market\\\’s actions. The news helps in understanding the events which affect the market. By keeping a track of all of these events one can easily make changes in their moves and maximize the results. It minimizes the risk as the traders get the time to make quick changes.

    Affordability

    TradingView Pricing Plans

    Tradingview hasn\\\’t kept prices so high that people don\\\’t get abandoned because of high rates. Tradingview pricing plan has free services available too and the plan cost $59.95 monthly which is dependent on the choice of plans picked.

    Screener

    Tradingview Screener

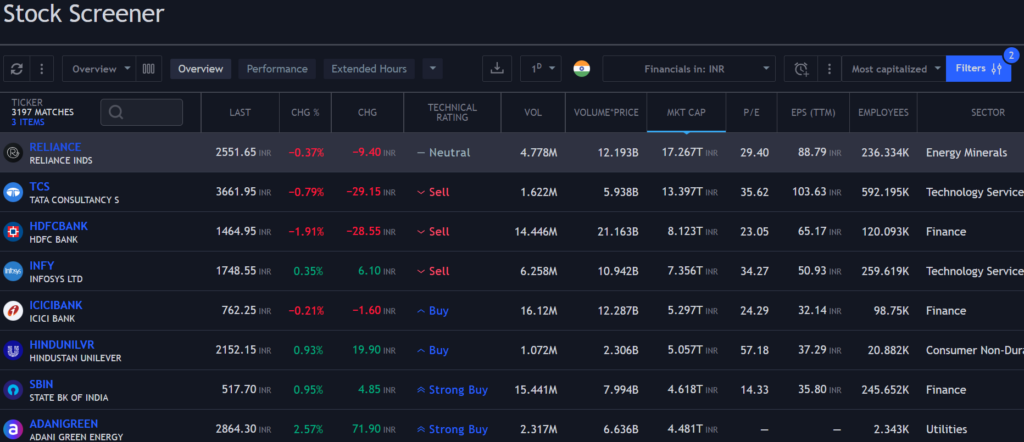
    The screener is the key feature of TradingView as it helps in getting faster results by using the best filters. The screener helps in finding the standard of a particular stock and getting a hold of the history of an asset. The screener is merged with every filter a user desires.

    Free accounts

    Tradingview Accounts

    Some users can\\\’t even pay a minimal fee to get their trading on the track. But TradingView has no plans to make them feel restricted. The free account services can be availed by these traders which gives access to limited features of the trading view. As it doesn\\\’t have all of the premium features but to some extent helps in getting a better idea of the market.

    What can we expect from Tradingview?

    how does tradingview work

    Tradingview offers more effective features to the users than any other platform. It stands upto the very expectation a trader can have from such an app. It helps in getting the hold over the several features and tools useful in understanding the market. Tradingview also has strong experience in this domain which generates enough trust in the hearts of users. It also has powerful technical analysis which drives better results for users and extracts finer returns.

    What are some pros of using Tradingview?

    Pros of using tradingview

    Trading Views has got some exciting pros which make it dominate the market of financial information. Some of such pros are as follows 🙂

    Affordability expands its reach in the domain of users as they can easily get premium subscriptions.

    Free accounts still are part of TradingView in this capitalized world. As limited features can still be enjoyed without paying a single penny.

    The technical analysis gets the job done for users and provides fast results

    The color code also contributes to the direct understanding of whether the stock has got positive returns or not.

    How to register for Tradingview?

    The registration process isn\\\’t an issue for traders using the trading view. They normally have to web search the platform over the internet using any kind of network. After going to the website one has to register by filling up the details and decide whether they seek a paid plan or wish to avail of free services. After paying the fees they can go through the premium features or in the case of using a normal registration some of the basic features can be used.

    Conclusion

    Tradingview Conclusion

    Tradingview is the best platform and easily beats its alternative ChartIQ. In terms of features and benefits, TradingvVew is far better than ChartIQ. The way it is structured assists users in accessing all of the information related to the market. ChartIQ has to get some features expanded and also try to add more attractive policies if they desire to get a bigger user base. But till the time it isn\\\’t fixed, TradingView will be on the top of the market. Tradingview has gained the trust of its users which has gifted customer loyalty to them. And customer loyalty is one of the most essential things a service provider seeks.

  • How To Use TradingView Heatmaps? Quick 10-Steps Tutorial

    How To Use TradingView Heatmaps? Quick 10-Steps Tutorial

    TradingView has become an indispensable tool for traders around the world, and one of its most powerful 💪 features is the heatmap.

    As someone who has been using TradingView for an extended period, I want to share my personal experiences and insights on how TradingView\\\’s heatmaps have transformed the way I approach the financial markets.💹

    📌Chapter 1: The Early Days

    I remember the days when I first stumbled upon TradingView. Back then, I was a novice trader, struggling to make sense of the ever-changing market dynamics.

    TradingView

    TradingView\\\’s sleek interface and user-friendly design immediately caught my attention, but it was the heatmap that truly piqued my interest.

    In the beginning, I used heatmaps primarily to monitor the market sentiment and identify potential trading opportunities.

    The heatmap provided a visual representation of price movements, making it easier for me to spot trends, clusters of activity, and areas of interest. I quickly realized that this tool could be a game-changer in my trading journey.

    ⤴️Chapter 2: The Learning Curve

    Stock HeatMap

    As with any new tool, there was a learning curve. I spent hours exploring the different features and customization options that TradingView\\\’s heatmaps had to offer. From adjusting the timeframes to selecting specific instruments, the possibilities were endless.

    One key aspect I embraced was the ability to focus on specific asset classes, such as forex, stocks, or cryptocurrencies, depending on my trading preferences.

    🪜Step-by-Step Guide: Mastering the Art of Market Analysis with TradingView\\\’s Heatmap

    TradingView\\\’s heatmaps allowed me to tailor my trading experience, helping me stay ahead of the curve in the ever-evolving financial markets.

    Step 1: Access TradingView

    Access TradingView
    • Create or Log In to Your Account: If you don\\\’t already have a TradingView account, you\\\’ll need to create one. Visit the TradingView website and sign up. If you already have an account, simply log in.

    Step 2: Navigate to the Heatmap Section

    Navigate to the Heatmap Section
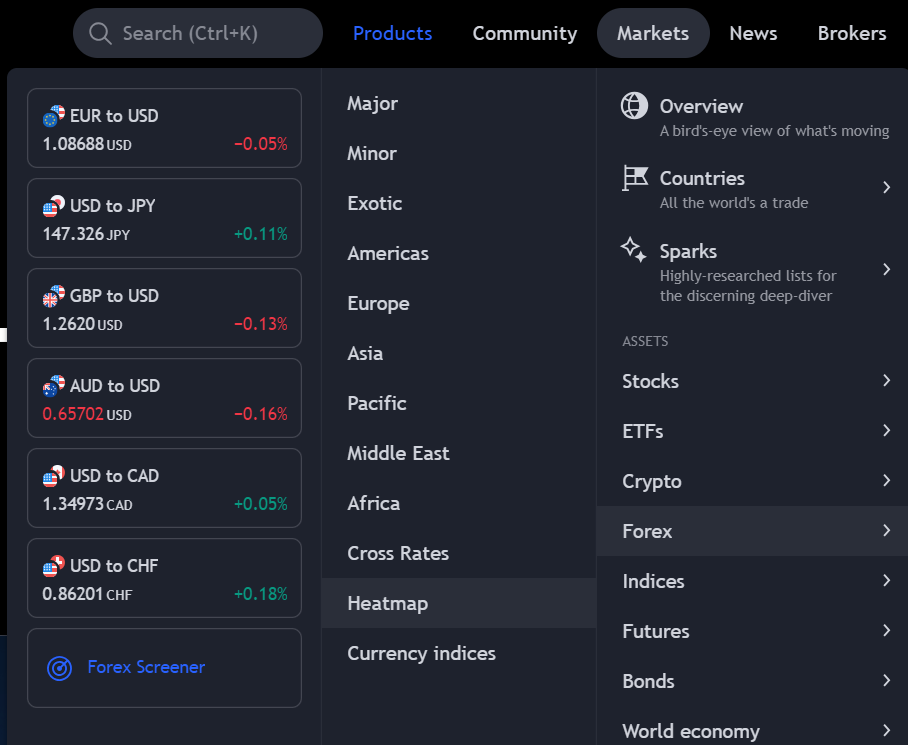
    • Find the Heatmap Tool: Once logged in, navigate to the \\\’Markets\\\’ section on the top menu. Under this, you\\\’ll find a submenu where you can select \\\’Heatmap\\\’. Click on it to access the heatmap tool.

    Step 3: Choose Your Market

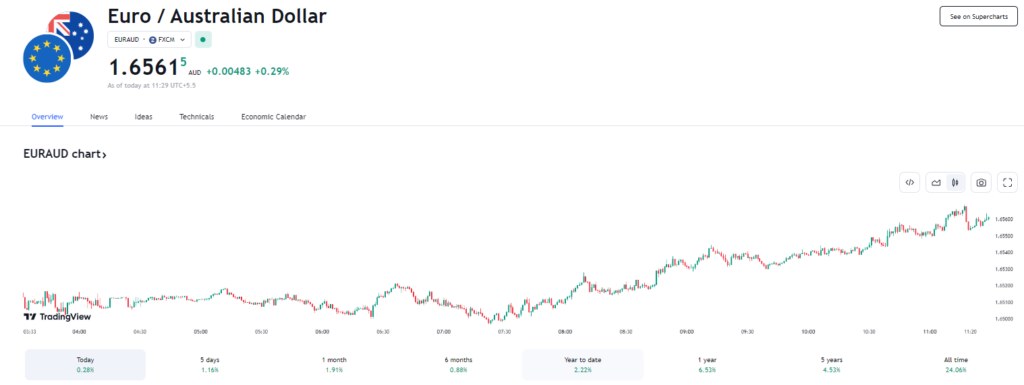
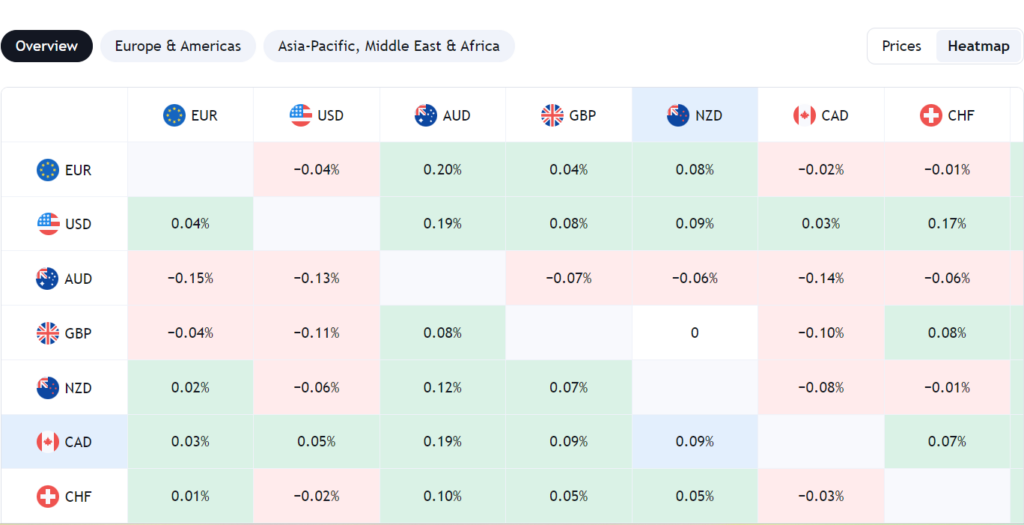
    • Select the Market: TradingView offers heatmaps for various markets such as stocks, forex, cryptocurrencies, etc. Select the market you\\\’re interested in analyzing.

    Step 4: Customize Your View

    TradingView Economic Calender
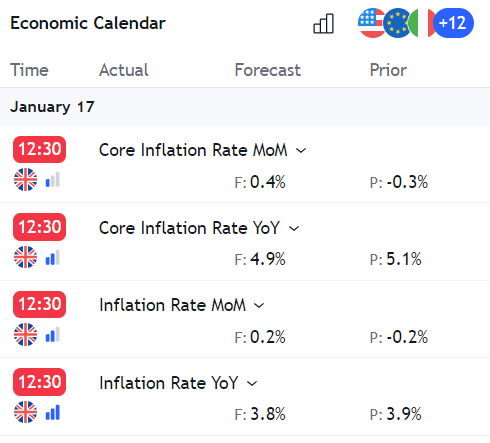
    • Adjust Time Frames and Settings: Depending on your trading strategy, select the appropriate time frame (e.g., daily, weekly, monthly). You can also customize other settings like the color scheme, what data the colors represent (e.g., price change, volume), and more.

    Step 5: Apply Filters

    • Use Filters for Specific Analysis: If you\\\’re interested in a specific sector, market cap range, or other criteria, use the filters to tailor the heatmap to show only the relevant data. This step is crucial for focusing your analysis on the segments that align with your trading strategy.

    Step 6: Analyze the Heatmap

    Choose Your Market
    • Interpret the Colors and Patterns: Analyze the heatmap by looking at the color patterns. Typically, green represents positive movement, while red indicates negative movement. The intensity of the color often shows the strength of the movement. Hover over individual elements for detailed information.

    Step 7: Dive Deeper into Individual Stocks or Sectors

    TradingView Further Analysis
    • Further Analysis: If a particular stock or sector catches your eye, click on it for more detailed information. This can include charts, news, fundamental data, etc., helping you make a more informed decision.

    Step 8: Integrate with Other Tools

    TradingView Technical Analysis
    • Combine with Other TradingView Tools: For a more comprehensive analysis, integrate the insights from the heatmap with other TradingView tools like charts, technical indicators, and fundamental analysis tools.

    Step 9: Set Alerts and Monitor

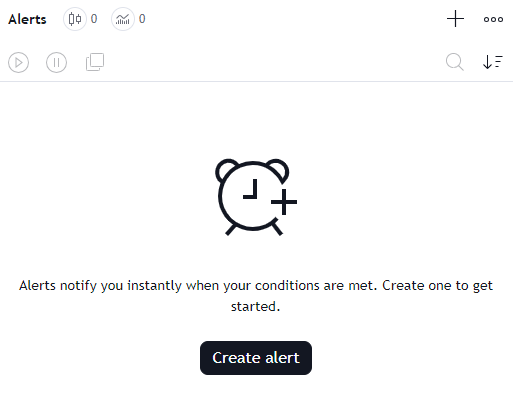
    TradingView Alert
    • Set Custom Alerts: Utilize TradingView’s alert system to get notified about significant changes in the stocks or sectors you are monitoring. This helps you stay updated without constantly watching the heatmap.

    Step 10: Keep Learning and Adjusting

    • Continuously Learn: Explore TradingView’s educational resources and community discussions to learn more about using heatmaps effectively. Adjust your approach as you gain more experience and as market conditions change.

    Quick Links:

    📌Chapter 3: Unleashing the Power of Color

    The color-coded heatmaps in TradingView were a revelation. Each color represented a different level of market activity, ranging from cool blue (low activity) to fiery red (high activity). This visual representation made it effortless to gauge the intensity of trading in real time.

    I discovered that by keeping a close eye on the heatmaps, I could spot potential breakouts, reversals, and even hidden support and resistance levels. It was as if the market was speaking to me through colors, and I was becoming fluent in this unique language.

    📌Advanced Features I Love in TradingView Heatmaps

    TradingView Heatmap Features

    TradingView heatmaps are not just visually appealing; they are packed with advanced features that cater to the diverse needs of traders. Here, I\\\’ll highlight four advanced features that I particularly love and find incredibly useful in my trading journey.

    📍Real-Time Data Updates

    One of the standout features of TradingView heatmaps is their real-time data update capability. In the fast-paced world of trading, having access to the most current information is crucial. The heatmap updates continuously, reflecting changes in the market instantaneously. This feature ensures that I\\\’m always making decisions based on the latest market movements, a critical aspect for day traders and those who rely on timing the market accurately.

    📍Customizable Filters

    The ability to customize filters in the heatmap is a game-changer. This feature allows me to tailor the data I see based on specific criteria like market capitalization, sector, industry, and more. For instance, if I want to focus on technology stocks or exclude small-cap stocks, I can easily set these filters. This level of customization helps in focusing my analysis on segments that align with my trading strategies, making the heatmap an incredibly flexible tool.

    📍Detailed Tooltip Information

    When hovering over a particular stock or sector in the heatmap, a tooltip pops up, providing detailed information. This feature includes data like the stock\\\’s current price, the percentage change, and volume traded. For a deeper analysis, some heatmaps also provide additional data like P/E ratio, market cap, and 52-week high/low. This on-the-fly detailed information is invaluable for making quick, informed decisions without needing to leave the heatmap interface.

    📍Historical Data View

    The ability to view historical data in the heatmap format is an excellent feature for conducting trend analysis and understanding historical market behaviors. I can look back at how specific stocks or sectors have performed over time, under different market conditions. This historical perspective is crucial for identifying patterns and trends that might not be apparent from just a current snapshot. It helps in developing a more comprehensive trading strategy that takes into account both historical and current market data.

    ⚠️Chapter 4: Customization and Alerts

    TradingView\\\’s heatmaps allowed me to customize my experience even further. I could set up alerts based on specific heatmap criteria, ensuring I never missed a potentially lucrative trade.

    Whether it was a sudden surge in activity or a divergence from the norm, I had the power to tailor my alerts to my trading strategy. The ability to overlay indicators on the heatmap was another game-changer.

    It allowed me to combine technical analysis with market sentiment, providing a holistic view of the market. This feature significantly enhanced my decision-making process, leading to more confident and informed trades.

    📌Chapter 5: Evolving with the Market

    Embracing Continuous Improvement

    As a long-term user of TradingView\\\’s heatmaps, I\\\’ve witnessed the platform\\\’s evolution, keeping pace with the changing landscape of the financial markets.

    Stock Heatmap Widget

    This chapter explores how the continual improvements and introduction of new features have enabled me to refine my trading strategies and adapt to shifting market conditions with greater ease.

    📍Introduction of Advanced Market Indicators

    • Volume Profile: This feature added a new dimension to my market analysis. The volume profile shows the amount of trading activity at different price levels. It helped me identify key support and resistance areas, where significant buying or selling occurred.
    • Order Book Data: Integrating order book data into the heatmap provided a real-time view of buy and sell orders in the market. This insight into market depth was crucial for understanding potential price movements and making more informed entry or exit decisions.

    📍Enhanced Customization and Filtering

    • Sector-Specific Heatmaps: As the market evolved, so did my need for more specific analysis. TradingView responded by enabling the creation of heatmaps focused on specific sectors. This allowed me to concentrate on sectors that align with my trading interests or the current economic cycle.
    • Custom Filter Options: The ability to create custom filters based on criteria like market cap, earnings, dividend yield, and more, helped me focus on stocks that meet my investment criteria, making the process more efficient and targeted.

    📍Integration with Broader Market Analysis Tools

    • Connecting with Technical Analysis Tools: TradingView integrated heatmaps with other technical analysis tools on their platform, allowing me to correlate heatmap data with technical indicators for a more comprehensive analysis.
    • Linkage to News and Economic Data: The ability to view relevant news and economic data alongside the heatmap enriched my understanding of why certain sectors or stocks were performing in a particular way.

    🔥Chapter 6: Conclusion

    Today, after years of using TradingView\\\’s heatmaps, I can confidently say that they have been instrumental in my trading success. From a novice trader struggling to make sense of the markets, I have evolved into a confident and informed trader, thanks in large part to this incredible tool.

    TradingView\\\’s heatmaps have not only made my trading journey more profitable but also more enjoyable. They have transformed the way I approach the markets, providing me with a unique perspective that sets me apart from the crowd.

    If you\\\’re new to TradingView or have yet to explore its heatmap feature, I highly recommend trying it. It\\\’s a tool that can revolutionize your trading experience, just as it did for me. Embrace the power of colors, customization, and market insights, and embark on your journey to trading success with TradingView\\\’s heatmaps. Happy trading!